
Compounding Leader? CovQ Insights: Growth, Innovation, Productivity
By Ralf Hirt, CEO, CovQ by 8W8, HBR Advisory Council Member, United States
April 18, 2025
This report aggregates insights from more than 10,000 data points from CovQ® Assessments conducted across industries to understand how companies perform in delivering mission, accelerating growth, fostering innovation, and driving productivity. CovQ—the Compound Value Creator Quotient—is the augmented intelligence of a new category of Value Creation Management Platforms (HBR AS Report “Mastering Value Creation”). It enables organizations to align strategy and execution through value-driver-based prioritization, monitoring, and collaboration. CovQ Scores and CovQ Factors or Team Alignment range from 10 (insufficient) to 100 (outstanding). This CovQ Insights Report—developed from proprietary data, artificial intelligence, and human insight—delivers deployable, time-sensitive intelligence to fuel strategic execution and outperform in growth, innovation, and productivity and to become a Compounding Leader.
- Only 26.4% Reach Compounding Levels: Just 4.5% of assessed companies qualify as Compounding Leaders (CovQ Score 85–100), and 21.9% as Strategic Compounders (75–84), leaving 73.6% operating below compounding performance levels.
- Massive Untapped Potential or Underleveraged / At Risk: The majority of companies remain Stabilized Performers, Opportunity Candidates, or Underleveraged / At Risk. This reflects a widespread underutilization of value creation levers—signaling major opportunities for growth, profit, and valuation gains.
- Growth Is a Capability, Not Just a Result: Higher scores in the Building and Deep segments correlate with stronger product launches, better market expansion, and improved conversion—proving that growth stems from structural capabilities.
- Innovation Needs Structure to Scale: High-performing companies combine creativity with disciplined execution, standing out in value drivers like cross-functional collaboration, initiative execution, and tracking.
- Productivity Comes from Strategic Focus: Companies with clear priorities and alignment outperform those with scattered efforts—highlighting the value of focused execution and strategic coherence.
CovQ Segments and Focus Areas
CovQ Segment Performance
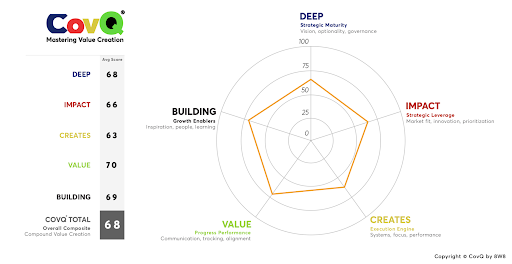
The 60 core CovQ value drivers are grouped into five segments that represent foundational pillars of value creation.
Each segment uncovers distinct strengths and risks:
■ DEEP – Strategic Maturity: Visionary leadership and governance strength are common. However, gaps in self-assessment practices and compound strategy thinking reduce long-term agility.
■ IMPACT – Strategic Leverage: Strong product fundamentals and cultural focus contrast with variability in pricing, differentiation, and GTM discipline.
■ CREATES – Execution Engine: This segment is consistently the weakest. Few firms manage execution with clarity, tools, or principles, resulting in strategic decay.
■ VALUE – Progress Performance: Internal communication is routine, yet often lacks instrumentalization — diluting alignment and slowing response times.
■ BUILDING – Growth Enablers: Executive learning, peer development, and thought leadership are underdeveloped, though companies acknowledge their importance.
Summary: Execution capability (CREATES) is the bottleneck. Leadership is present, but delivery systems remain fragmented.
CovQ Score Tier Distribution
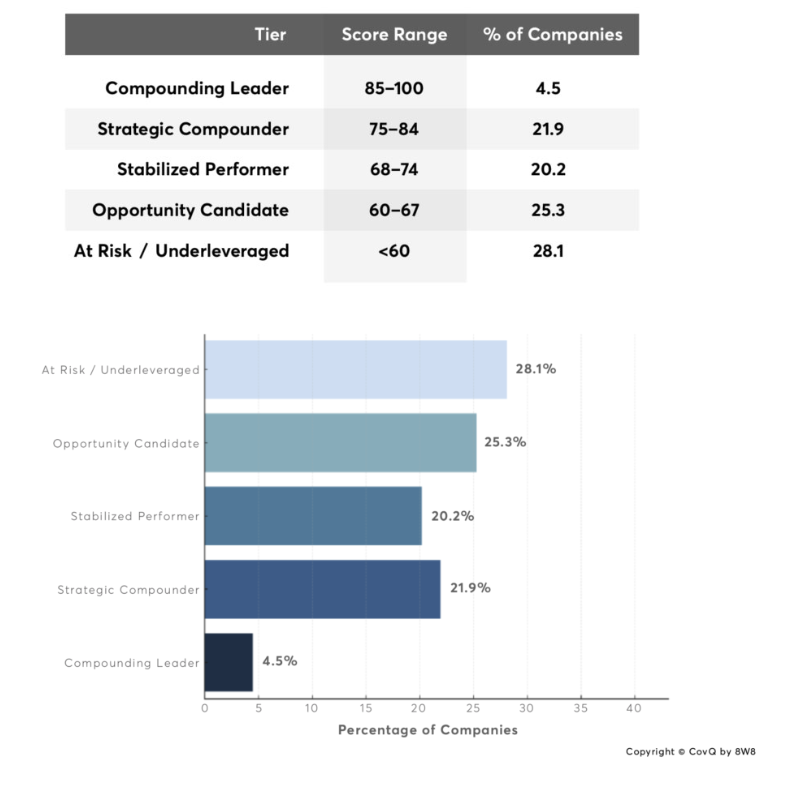
CovQ Score Tier Definitions
Compounding Leader (85–100): Companies operating at the highest level of value creation. They exhibit complete alignment between strategy and execution, with systems in place that allow value to compound over time.
Strategic Compounder (75–84): Organizations with strong strategic alignment and execution, showing clear momentum toward sustainable growth and efficiency gains.
Stabilized Performer (68–74): Firms with a solid foundation in place, executing moderately well but still with unactivated or underleveraged potential.
Opportunity Candidate (60–67): Companies with meaningful upside if strategic discipline, prioritization, and execution capabilities are improved.
At Risk / Underleveraged (<60): Organizations lacking alignment or systems to execute effectively. These companies are likely leaving substantial value on the table.
Quadrant Analysis: CovQ Score vs. TEAM Alignment Factor
This quadrant explores the relationship between CovQ Score and the TEAM Alignment Factor across organizations. TEAM Alignment in the CovQ context is not about interpersonal teamwork—it reflects how well leadership and decision-makers are strategically aligned. It captures whether leaders share a clear understanding of the strategy, priorities, and the value drivers that enable execution and outcomes.
This updated heatmap-style visualization reveals meaningful patterns:
- Top-right quadrant: Strategically strong and aligned teams—likely to compound value over time.
- Bottom-right quadrant: High CovQ Score but low TEAM Alignment—these firms may face execution drag or internal misalignment.
- Top-left quadrant: High alignment on an unclear or weaker strategic foundation—suggests an opportunity to upgrade the strategic model.
- Bottom-left quadrant: Disconnected leadership and strategic gaps—highest risk, greatest upside.
CovQ Scores vs. CovQ Team Alignment Factors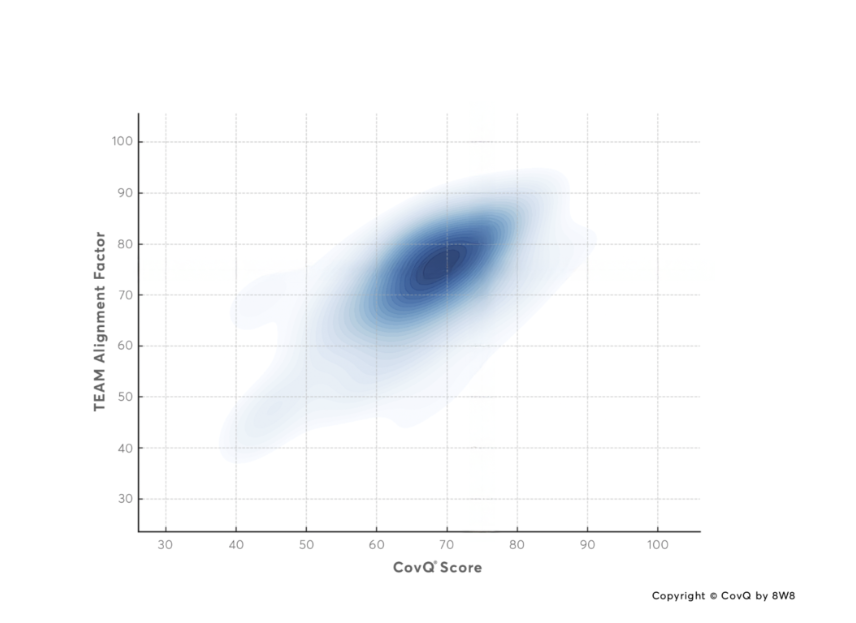
Conclusion: Compounding Value Creation is Rare—But Achievable
Only 4.5 % out of the assessed companies qualified as Compounding Leaders with CovQ Scores between 85–100. Another 21.9% of companies were Strategic Compounders, bringing the total above the compounding threshold to just 26.4% of the sample.
This means that 73.6% of organizations are still operating below compounding levels. These include Stabilized Performers, Opportunity Candidates, and At Risk, Underleveraged companies. The gap highlights a systemic underutilization of value creation levers—and an immense opportunity for growth, profitability, and valuation uplift through structured, value-driver-based execution.
Starting is Key:
https://www.8w8.com/contact-us/